 English
Our Data
AUTOMOTIVE INDUSTRY IN HUNGARY 2013
Sectoral analysis
This study aims to give a whole picture about the performance of the Hungarian automotive industry and for this I apply index numbers, time series analysis and other multivariate statistical methods gained from the financial statements of the companies operating in the sector. Having regard to the importance of the sector in the national economy I put special focus on the role of the foreign companies and the financing model applied by them.
I have downloaded the financial data of the companies operating in the automotive industry from the company database of céginformácio.hu Kft. The raw data, financial statements and manpower data of all business organizations registered in Hungary can be found here. The sector of the automotive industry can be well defined by the NACE (The Integrated Branch Classification System of the Activities) classification, and therefore the 29 (production of road vehicle) and the 30 (production of other vehicles) codes were selected and used as a basis for the analysis. In case of the time series analysis I worked with the whole database because in the previous years the currently inactive companies were also part of the branch.
The time series analysis of the ratios
In terms of the net sales there are two periods, which boundary is the economic crisis in 2008. An upswing was observable until the mentioned date, when the examined ratio amounted to 14,1 billion euro followed by a significant, 28 % decrease in 2009. The branch reached the level of 2008 in nominal values in 2012 (in fact, exceeded it with 800 million euro), which was followed by an increase of 17,3 % and resulted in the revenue of 17,5 billion euro of the current year. The three flagship companies, Audi Hungaria, Mercedes-Benz Manufacturing and Magyar Suzuki own the 54.3% of the total market, which refers to the high concentration of the sector. This is supported also by the fact that 90% of the revenue is concentrated in 33 companies and 29 of them have a foreign owner. The whole sector is determined by a foreign dominance as the 92 % of the revenue can be connected to these companies while their number is significantly lower than the domestic-owned firms. The current year's growth is largely due to the increase of Mercedes’ 1,15 billion euro growth in the examined result line, in addition I have to mention the performance of the other dominant players as 8 out of 10 companies with the largest turnover have been able to achieve growth in the given ratio compared to 2012.
Figure 1. Net sales and P/L before tax from 2008
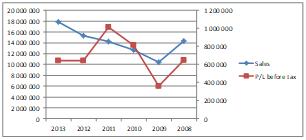
Source: Source: Own elaboration based on Ceginformacio.hu database
The export turnover is characterized by a similar concentration, here concentrates the 90% of the sector output by 22 companies, only Audi has a 36% share. The Hungarian automotive industry is characterized by a very high export orientation, the lowest value of the sectoral export ratio was 87% during the examined period and in the current year peaked with 90.8%. 9 out of the 10 companies with the highest revenue had at least an index of 90 % in 2013, the 99,7% export ratio of Mercedes and 97,8% export ratio of Audi rank amongst the highest. 77 out of the 107 companies with foreign owners had export sales, in case of the Hungarian companies, that are in the majority regarding their numbers, this can be said only in 55 cases. The operating profit index of the sector varies widely, here also the year of 2009 was the lowest point. The next two years meant the start-up period, the core business activity generated a revenue of 1 billion euro by 2011 which was the highest in the last 10 years. The decline of 380 million euro experienced in the following year largely was due to the update of the clearing price system of the Audi Hungaria occurring in the other expenses category. The current year has been experiencing an increase of 106 million euro while a negative financial result of 101 million euro was suffered in the sector so the profit before tax line virtually didn’t change. The growth of the revenue resulted in similar movements in case of the expenses as well, the material costs were increased by 2,2 billion euro, the costs of employees by 83 million euro in a year. At the beginning of the examined period the aggregate financial P/L was positive, from 2009 values close to zero were typical except for the year of 2013. In terms of P/L before tax 486 companies were on the positive side, altogether realizing a profit of 778 million euro. 48% of this is concentrated at the two large companies, at Audi and Mercedes. 322 companies reached a negative result, they have suffered a loss of 197 million euro, the Johnson Control itself made a loss of 45,6 million euro of it. However, it is clear that the profit before tax is affected more by the income generated by the core business activity as a result of the financial operations including the cost of liabilities.
Figure 2. Result of financial operations
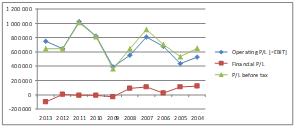
Source: Own elaboration based on Ceginformacio.hu
Analysis of efficiency ratios
Besides the profit margin the return on equity and the assets were examined from the efficiency ratios. The ratios have been calculated with the correction of the extraordinary items. The three examined ratios changed similarly in the examined period, the year of 2009 had the lowest values similarly to the earlier examined ratios, however the efficiency experienced at the beginning of the period exceeds the ones experienced in the last few years. On the one hand this can be partly explained by the post-crisis recovery period, on the other hand by the turnover; the increase of the fixed assets and the number of employees suggest that the expansion of the sector is in progress currently as well and the return of the required expenses is expected in the forthcoming years. The increase of the revenue experienced in the current year wasn’t followed by the increase of the profit after tax so the profit margin dropped from 4,2 % to 3,6 %. The negative influencing impact of the result of the financial operations has to be mentioned here as well as the efficiency of the revenue generating capability of the core business activity didn’t changed compared to the year of 2012. So it is easily recognizable that the current year decrease of the ROE and the ROA isn’t due to the decline of the profit generating capability but to the increase of the shareholders funds occured in their own line. Based on this the year of 2011 is of outstanding importance when nominally all of the three involved balance sheets showed the highest value of the examined period and the efficiency ratios calculated from them showed a more positive picture as well. In 2012 there was a significant capital withdrawal in the branch when Audi Hungária decided about the payment of the dividend of 3 billion euro. 2,67 billion euro of this was charged to the retained earnings which was 33,5 % of the shareholders’ funds of the entire sector. The assumed negative impact of the previously mentioned profit decline was set off by this drop so the ROA was more moderate (Figure 3.).
Figure 3. Evolution of profitability ratios in the automotive industry
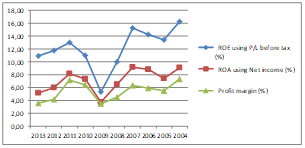
Source: Source: Own elaboration based on Ceginformacio.hu database
Analysis of the capital structure ratios
In 2013 the share of the sectorial liabilities was 46,3 % compared to the total liabilities, so it was altogether 5 percentage points more than at the beginning of the period, in 2004. Until 2009 a steady decline is observable in case of the ratios when the proportion of the liabilities dropped below 30%. Then the ratio began to rise again and reached its current level. In terms of the expiry the dominance of the current liabilities is typical. While the share of the non-current liabilities altered only between 6,8 % and 11,1 %, the same in the case of the current liabilities is 20,8 and 34,3%. However the proportion of the short term loans in case of the current liabilities scarcely reaches the 3% in the current year, the ratio was the highest in the year of 2009 (14,81%). Regarding these facts I draw a conclusion that the lending doesn’t have a significant role in the Hungarian automotive industry. The market share of the companies that can be related to foreign owners exceeds the 90 %, the ratios describing the profitability remained constantly in the positive range so the financing of the sector doesn’t have any special risks.
The share of creditors oscillated at higher levels within the short term liabilities. Apart from the decline of 2006 the ratio was above 30% but a clear trend would be hard to determine. Generally we can say that companies with significant market power are in more favorable position in terms of creditors than their less dominant competitors. The applied long term payment deadlines and the dependency of creditors support that funding method. Moreover the share of short term liabilities has similar evaluation as the share of total liabilities since there is a minimal oscillation in case of the long term liabilities.
Figure 4. Evolution of short and long term liabilities ratio
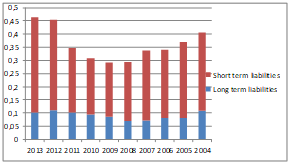
Source: Source: Own elaboration based on Ceginformacio.hu database
The role of over one year funds already considered marginal in the Hungarian automotive industry as the ratio barely exceeded 10% in the examined period. This is remarkable in the light of fixed assets dominated over current assets from the year 2012 and the growth is clearly occurred at the tangible assets line. As a result of this the aggregate value of tangible assets reached the 50%.
References
Szucs,G (2015): The financial analysis of the Hungarian automotive industry based on profitability and capital structure ratios. Central European Business review, Vol 4 (1), 61-73. <