 English
Our Data
ANALYSIS OF PHARMACEUTICAL PRODUCTS MANU-FACTURING IN HUNGARY 2020

Economic crisis did not cause a breakage in Hungarian pharmaceutical products manufacturing sector, of what we can determine, besides the four dominant players we do not really find a company which might have a say into this competition in the near future. That is why performance of leading companies will be the determinative factor for further development of the sector, who were also the engines of the growth in the past year.
Pharmaceutical industry is relatively well defined according to fields of activities because it is rather precise definition (NACE 21, Manufacture of basic pharmaceutical products and pharmaceutical preparations) and on the other hand the largest companies are registered with this code in the company register. According to this we found 107 active companies in Hungary in 2020. Taking this field of activity further apart we distinguish manufacture of basic pharmaceutical products (NACE 211) and manufacture of pharmaceutical preparations (NACE 212). The importance of the latter is absolutely dominant in the sector because among the 10 largest companies only Bogdány Petrol Kft. has manufacture of basic pharmaceutical products registered as its main activity, but examining the company’s profile, they are rather closer to oil industry. That is why certain sectors will not be compared during the analysis due to differences in order of magnitude.
Among the four large companies mentioned in the prologue, in case of Teva Gyógyszergyártó Zrt., Chinoin Zrt. and EGIS Zrt. foreign capital is dominant, while in case of Richter there is a 25% state-owned part.
Market share of companies operating in pharmaceutical products manufacturing industry in Hungary in 2020.
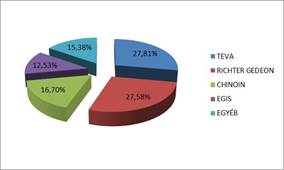
Source: Ceginformacio.hu
Among the leading companies TEVA cleaves the biggest part, by 911 million eur net revenue which is 8% higher than a year ago, with this it splits 27,8% from the total Hungarian market. Richter is not far behind by 8 million eur, who could not keep up with the growth of TEVA, therefore it got to the second place. It is said much of the concentration of the market that 55% of the sectoral net revenue are linked to these two companies, supplemented by Chinoin and EGIS, this value almost 85%. The 14% growth of Chinoin is outstanding in the whole sector. During the examination of financial data we tried to focus on the realized revenues in this sector only, that is why we took the values of non consolidated accounts only into consideration. The role of wholesalers should be mentioned here, because there is a company, which does not operate such organization separately, so revenues originated from this also appear in the numbers of companies marking manufacturing. Â
Net revenue of companies operating in pharmaceutical products manufacturing industry in Hungary in 2020. Data in thousand EUR.
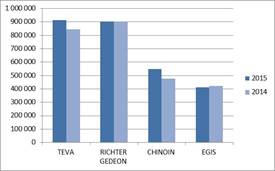
Source: Ceginformacio.hu
In the year 2020 net revenue of the sector was 3,48 billion eur, which is 6% higher than a year before. By examining the diagram, growth of the sector can be considered steady, there was only a minor setback in 2013, which was corrected in the next two years and for today net revenue of pharmaceutical products manufacturing has reached newer peak.
Net revenue, export net revenue and P/L before tax of pharmaceutical products manufacturing industry. Data in thousand EUR.
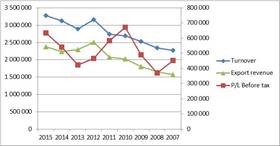
Source: Ceginformacio.hu
Export share fluctuated between 65 and 75% troughout the examined period, it was 69% in the current year which is exactly in the middle way. The highest ratio was in 2012, while we measured the lowest 65% in two years, in 2008 and 2009. At company level over 80% value has been produced by Richter and Chinoin (81 and 80%), export ratio is slightly lower at TEVA, it was 59%. It follows, that Richter is the largest exporter of the sector, nearly with 800 million eur, it is followed by TEVA with 593 million eur, whom we immediately get the answer for the reason of the performed net revenue increase of the current year, because practically the entire growth is due to the expansion performed in the export line. Although result in 2020 is higher, than the performance of the previous two years but it does not reach the numbers of the year 2012, when the sectoral export was 2,5 billion eur.
In terms of profit positive developments have taken place in the year 2020, because P/L before tax has increased by 15,3% at sectoral level to 635 million eur, which is the second best result of the examined period, what is just behind of 672 million eur from 2010. Similarly to net revenue here also TEVA is the leader company, improving by 16 million, it realized 266 million eur in the current year.  Although result of Richter is slightly behind of this (201 million), however there is a significant increase compared to 2020, nearly 138 million eur. At the other two members of the quartet, there is a slightly decreased profit, result of Chinoin decreased from 172 million eur to 130 and EGIS’s from 44,3 to 8,3. It clearly shows that sectoral progress is mainly due to profit growth observed at Richter.
Operating result and P/L before tax of companies working in pharmaceutical products manufacturing industry in Hungary in 2020 and 2020. Data in thousand EUR.
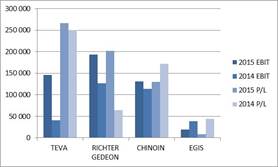
Source: Ceginformacio.hu
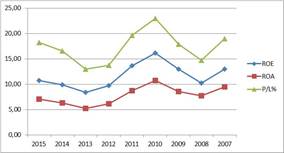
Profitable ratios of the sector
In connection with the examination of net revenue and profit it is worth to have a look at ratios describing profitability, within them first P/L before tax as a percentage of net revenue so the profit margin. In 2020 this was 18,2% at sectoral level, it continuously increased from 13% which was the low point in 2013. Here also the year 2010 was the culminating point, when 23% was the ratio, then came a steady decline until the already mentioned 2013 year, from there another continued growth can be observed. With regard to the other industries, this profitability is considered outstanding. In freight transport we rarely find values exceeding 5%, the same is true for vehicle manufacturing which is a key sector, where typically 10% is the upper limit. Trends are similar in case of ROA (return on assets) and ROE (return on equity). At the former the performance was 7% and 10,7% for the latter in the current year, the culminating point was in 2010 performing 10,7 and 16,1% values.
Profitable ratios of pharmaceutical products manufacturing industry. Data in %.
Source: Ceginformacio.hu
At company level among the three largest companies, all performed profit margin over 20%, the best was TEVA by 26,8%, it is followed by Chinoin by 23,2% and Richter is the last one by 20,6%. Performance of Chinoin was remarkable in 2020, where this ratio was 35%. EGIS due to weaker profit in the current year can not reach 2% in 2020.
Staff and other efficiency ratios
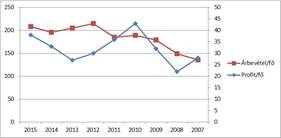
The number of employees has reached its peak in 2020, 16 749 people worked in the sector. This was 102 persons more than a year before, there was a higher growth in 2020, when the number of employees increased by nearly 800 people. Crisis-specific trends cannot be observed here either, increase of number of employees has been continuous since the late 2000s. Net revenue per person has been performed according to this, which was 208 thousand eur in the current year. Similarly to that what was experienced during the examination of net revenue, the year 2012 somehow stands out from the steadily rising trends, moreover in this case the 215 thousand value means the culminating point of the examined period. From this TEVA and Chinoin differ upwards, net revenue per person was 332 and 372 thousand eur in 2020, in case of Richter and EGIS we can see somewhat lower numbers (187 and 150 thousand eur). Profit per person culminated in 2010, in this year 43 thousand eur got per an employee. After that a steady downward trend can be observed until 2013, then a climb back period has come up to the present when this ratio reached 38 thousand eur.
Net revenue per person and P/L before tax of pharmaceutical products manufacturing industry. Data in thosand EUR.
Source: Ceginformacio.hu
At corporate level Richer was close to the average, where 39 thousand eur got per an employee in the current year, TEVA and Chinoin produced nearly the same profitability, significantly away from the sectoral average, 89 and 87 thousand eur were the profit per employee.
P/L before tax per person of companies operating in pharmaceutical products manufacturing industry in Hungary in 2020 and 2020. Data in thousand EUR.

Source: céginformácio.hu Hungary
By the examination of labour efficiency it is worth to have a look at personnel expenses, of which it is possible to conclude only with reservations to wage level, however from the trends we can get a general idea about processes taking place in the sector. Personnel expenses per person were 24 thousand eur in the past 4 years in pharmaceutical products manufacturing industry, which is outstanding at national economy level. There was a small decline in 2010 and 2011, for what saving arrangements applied during the economic crisis must be an explanation. One of the best indicator of costs of employees is net turnover divided by personnel expenses, which shows what percentage of wage costs makes up a unit of net revenue. Obviously, the lower the value, the more effective the company, such as labour expenses results in more net revenue. At sectoral level this ratio is stably around 10%, the fluctuation has not exceeded 1% in positive and negative directions in the past 6 years. At the beginning of the examined period the ratio was slightly higher (it was 13% in 2007), then during 3 years gradually reached the already mentioned 10% level. This value is slightly better at TEVA, than the sectoral average, it was 7,9% in the current year, non-conslidated data is available for Chinoin, the ratio was 8,6% here. Â Â