 English
Our Data
ANALYSIS OF PHARMACEUTICAL PRODUCTS MANU-FACTURING AND WHOLESALE IN HUNGARY 2020

In the current analysis we examine the performance of Hungarian pharmaceutical products manufacturing in the past 5 years, where the sector mentioned in the title also includes manufacturing and wholesale trader activity. Our aim is to follow up the development of certain sectors and also comparing the two segments, because interdependence is obvious which might occur in ratios describing the performance.
Preparation of the database was done by screening field of activities describing these sectors. Luckily in both cases the examined segments are clearly defined by NACE codes, therefore there was no need to examine further activities. In case of pharmaceutical products manufacturing code 21, „Medicine production” got into the centre of examination, while in case of wholesale trade code 4646 „Wholesale of pharmaceutical goods” was selected. We used Orbis database of Bureau van Dijk for selecting and aggregating data, which contains about 150 million companies from approximately 250 countries of the world. In case of Hungary the database is full, thanks to céginformácio.hu Kft. who supplies domestic data. During data export the balance sheet lines and ratios which wanted to be examined also were selected at corporate level, so beside the aggregated data it was possible to explain the changes at corporate level.  During the analysis we took the non consolidated data into account, so those related accomplishments which were realized in other sectors or countries are not part of the analysis.
The total net revenue of manufacturing and wholesale trade was 7,47 billion eur in 2020, greater part of it is related to wholesale trade sector, a total of 4,29 billion eur. No significant movement happened in the past 3 years, although data of the current year was the lowest, however the fall was just over 100 million eur, which represents only 1,7 % decrease compared to the highest point in 2012. The most significant growth was in this year, total net revenue of the two sectors has increased by nearly 10% compared to data of previous year. Dynamics of increase was slightly higher in case of pharmaceutical products manufacturing, where however decrease was somewhat more intense in the next 2 year, but considering the rate is still not significant.  At corporate level Richter Gedeon Nyrt. and TEVA Zrt. are the leaders of the sector, 926 million eur net revenue of the former in the current year, is 6% less than a year ago, just the opposite can be said about TEVA, where the increase is continuous and came close to the numbers of Richter by 2020. At the same time we remark here in case of TEVA performance of wholesale trade also appears in financial reports of that company which operates in pharmaceutical products manufacturing, so this comparison does not really reflect the power relations.
Change in net revenue from 2010 until 2020. Data in thousand EUR.
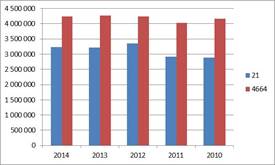
Source: Orbis database
Hungaropharma is found at the first place regarding net revenue in wholesale trade, it is closely followed by Phoenix Pharma and Sanofi Aventis is slightly behind at the third place. For the latter decrease of net revenue was significant for 2020, because the difference of 150 million eur is about 25% of net revenue of the previous year. The first three companies are divided by a more expressive gap from the next firms, four of them also managed to cross the 100 million eur limit in the current year. Pfizer was dropped out from this circle, it perfomed above this level from 2010 until 2013, after a steady decline the net revenue fell back to 89,2 million eur by 2020. Accordingly pharmaceutical products manufacturing sector is characterized by a higher concentration, because 55% of sectoral net revenue is linked to two companies, Richter and TEVA, 8 companies share at 90%. In this respect the wholesale trade is somewhat more balanced, although 50% of the net revenue can be linked to only four companies here. However 90 % is already summed up by 44 companies, which is significant difference compared to what was experienced in pharmaceutical products manufacturing sector.
A slight decrease can be experienced at export net revenue line, which is roughly declined in the same extent from 2012 over the next two years. Considering its proportion the decline was rather presented at wholesale trade, here the export net revenue decreased by 140 million eur in two years and reached the actual 806 million eur level.
Change in export share from 2010 until 2020. Data in percentage.
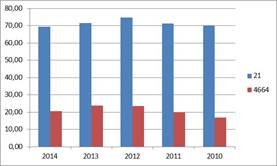
In the field of manufacturing it was more moderate, the export fell back sligtly with more than 10%. The export share is much higher here than at wholesale trade, which however also shows a decrease. It can be seen from this, the previously mentioned net revenue decrease is entirely owed to the fallback experienced at export line. Net domestic sales revenues were able to compensate this at wholesale trade, which is illustrated well by the stagnation of net revenue beside decreasing export share.
P/L before tax of pharmaceutical products manufacturing has declined constantly during the examined period until 2013, and a smaller increase was observed in the current year. Generally it can be said most of the profit is realized in pharmaceutical products manufacturing sector, the performed results were higher in each year. 568 million eur have been performed in 2020 which is 28% higher than a year before but it is less by 18% from the 690 million eur which was reached in 2010. Fluctuation experienced in the whole market is controlled by the performance of pharmaceutical products manufacturing sector.
Change in P/L before tax from 2010 until 2020. Data in thousand EUR.
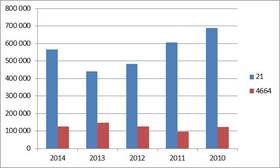
Source: Orbis database
In case of wholesale trade 95 million eur P/L before tax was the nadir in 2011, apart from this the given ratio is well balanced, which performed 120 million eur P/L before tax for 3 years. Two companies, Teva and Chinoin were able to perform net revenue over 100 million eur in 2020. In case of the former 250 million eur is the highest result of the past 5 years and examinining the whole sector only      Richter’s profit in 2011 was even higher. Increase in the current year is owed to the performance of these two companies, because the numbers of Richter and EGIS showed decrease compared to the previous year. Phoenix Pharma maintained its leading position in wholesale trade for the given ratio, 20 million eur result in 2020 is 2,3 million more than a year before. So it has 12% of the whole sectoral profit for its own. 502 companies got into the positive side, by realizing a total of 167 million eur, the loss of 22 million is related to 186 companies. Profit is rather concentrated similarly to the net revenue in manufacturing, 74% of it, a total of 422 million eur is linked to  TEVA and Chinoin, by completing it with the numbers of Richter and EGIS we already receive 93% of the sectoral profit. 90% of the loss is linked to one company to Alkaloida Vegyészeti Gyár Zrt.
Profitable ratios of the sector
By knowing net revenue and profit data from them the development of profitable ratios already could have been concluded. Profit margin ratio shows a completely different picture in the two sectors, which is ratio of P/L before tax and net sales revenues. In 2010 the ratio was 23,9% in pharmaceutical products manufacturing sector, which is the highest value in the examined period. The 17,6% ratio of the current year is somewhat lower than the numbers at the beginning of the period, however it is 3 and 4 percentage points higher than in 2012 and 2013. In case of wholesale trade the ratio was the highest in 2013, at that time profit/net revenue was 3,4% which shows a quite balanced picture in the past 5 years: it moved along a narrow interval, where the difference between the lowest and highest value barely reached 1 percentage point. The return on assets ratio (ROA) has not shown much difference between the two sectors, in the knowledge of profit numbers it is due to low assets of wholesale trade. The two ratios almost stood on identical levels in the current year, it exceeded 7% by 1 or 2 tenth of percent. In case of pharmaceutical products manufacturing similarly to the previously examined variables, a downward trend has been broken by a slight upswing in 2020. In case of wholesale trade such tendency cannot be discovered, we rather witness a gentle banding. Although there was a significant difference in profit numbers in favor of pharmaceutical products manufacturing, staff ratios already show a completely different picture. In the current year profit per person is 2,2 times higher in pharmaceutical products manufacturing compared to wholesale trade, in the light of the profit was nearly five times higher, this indicates significant difference reagarding the efficiency of labour. Both sectors are characterized by the trend similar to the previous ratios, the end of a continuous decline and sidling in a narrow lane.
Compared to Hungarian circumstances costs of employees per person can be considered high which obtained 29 thousand eur in some years in wholsale trade sector. Â
Change in costs of employees per person from 2010 until 2020. Data in thousand EUR.
Source: Orbis database
Data in the current year is sligtly lower, it is 25 thousand eur, same data of pharmaceutical products manufacturing is only a thousand eur less from the same year. We do not experience high movements at pharmaceutical products manufacturing, the value was around 24 thousand eur, it was different only twice in the past 5 years, once it was positive and once turned into negative direction. The ratio of costs of employees/net sales revenues is also interesting, which determines how much labour is required to produce one unit of revenue. In the current year this was 10,3% in pharmaceutical products manufacturing, so 103 eur costs of employees got to 1000 eur net revenue, from what it can be seen the lower value of ratio is desirable. Based on this we can say the wholesale trade sector is more effective, where less than a half, 5% was the examined ratio in 2020. Both sectors are balanced in this area, some differences are hardly observed compared to the average of 5 years.
Analysis of capital structure
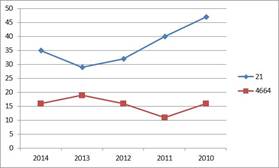
We also can experience significant differences between the two sectors in terms of capital structure. The proportion of foreign capital is increasing slightly higher in pharmaceutical products manufacturing, however this is hardly over 35% in the current year.
Change in the proportion of foreign capital from 2010 until 2020 in Pharmaceutical products manufacturing. Data in percentage.
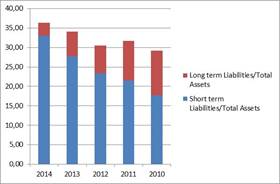
Source: Orbis database
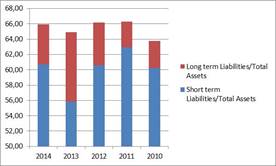
Foreign funds are mainly consist of short term liabilities, the role of long term funds has become marginal for today. It even exceeded 10% in the years 2010 and 2011, decline has continued since then. Similar trends has not been found in wholesale trade sector, however the rate of different types of sources varies much more hectic. The role of foreign capital is much higher here, which exceeded 60%Â in all examined years. 65,9% in the current year is less than 1 percentage point lower than the top value in 2011.
Change in the proportion of foreign capital from 2010 until 2020 in Pharmaceutical wholesale trade. Data in percentage.
Source: Orbis database
Long term liabilities do not play a significant role here, their proportion was 5,2% in the current year and except for the year 2013, have not even exceeded this level.
Change in proportion of suppliers from 2010 until 2014. Data in percentage.
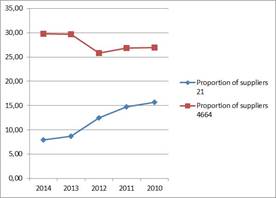
Source: Orbis database
Proportion of suppliers within short term liabilities was significantly higher in wholesale trade during the examined period. Each year the rate was close to 30% level, in case of pharmaceutical products manufacturing after a steady decline it performed 8% in the current year. The rate of short term loans is not significant in none of the sectors, therefore other short term liabilities dominate in both cases for these types of sources. Despite the fact the role of long term sources is negligible, but take a look at the development of coverage of assets. For this an excellent ratio is the proportion of tangible assets which shows the rate of fixed assets within total assets. In wholesale trade, where only minimally, but the ratio of long term sources was higher (5,2%), the ratio of tangible assets was 10% in the current year, this is 3,3 and 17,8 % in case of pharmaceutical products manufacturing, despite the fact that there would be coverage at asset side and the business course also would allow the involvement of bank funds, the two sectors rather rely on their own sources and supplier credit is mainly used by wholesale trade as type of source.